XRP Downtrend Deepens as Sellers Keep Control
At 10:14 a.m. ET on June 5, XRP was trading at $1.110, near its recent low of $1.091, after extending a sustained pullback from its May 30 peak of $1.364. The decline has kept XRP under pressure, with the price continuing to form lower highs and lower lows into early June.
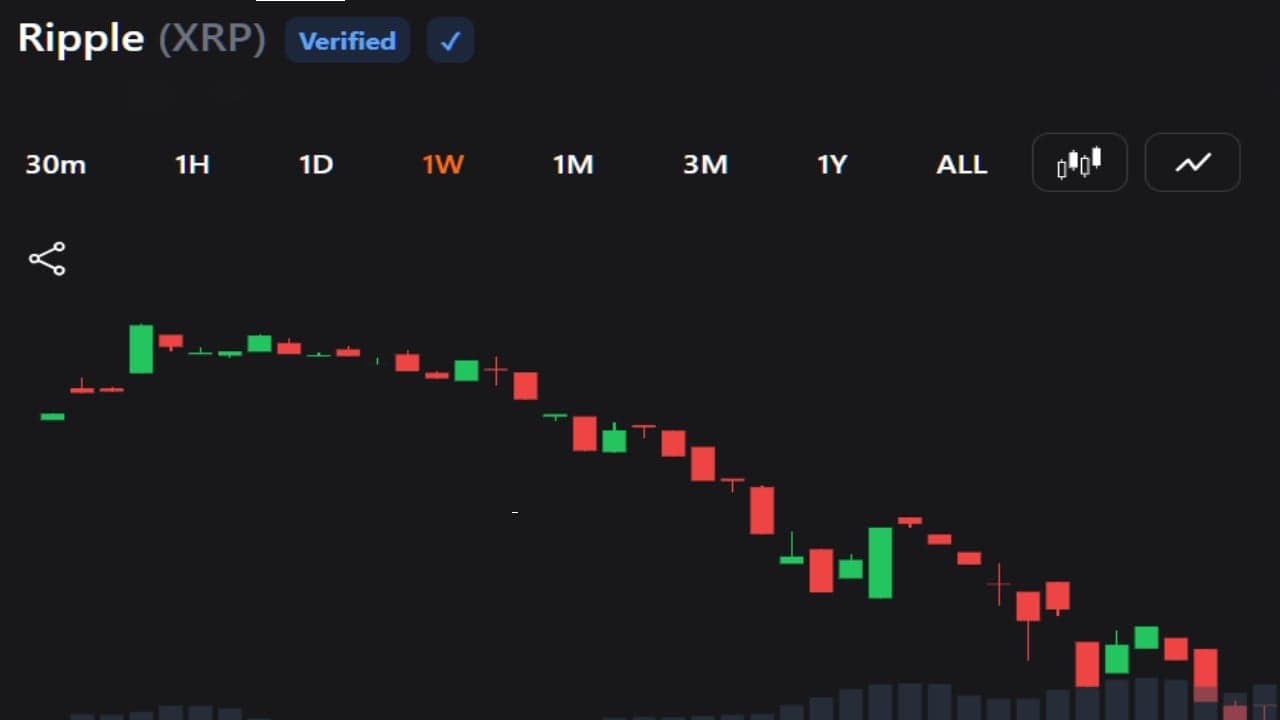
From a short-term chart perspective, XRP remains in a clear downtrend after failing to hold above $1.30. Price is attempting to stabilize, but buying momentum remains weak. Volume picked up during the latest decline, indicating sellers remain in control.

XRP Tests February Support as Breakdown Risk Builds
XRP’s slide below $1.11 has put February support at $1.1188 back in focus. An analysis published June 4 by IG market analyst Axel Rudolph identified that level as critical. IG Group is a FTSE 100 financial technology company serving more than 1.3 million customers worldwide.
Rudolph’s technical outlook turned increasingly bearish after XRP broke below the February low. He said the token remains under pressure while trading below the June 3 high at $1.2470 and the May 30 high at $1.3640, leaving the market vulnerable to additional downside if buyers fail to regain control. He said:
“Provided that the February low at $1.1188 holds on a weekly chart closing basis, a recovery may ensue. In this case the February-to-May lows at $1.2663-to-$1.2806 may act as resistance.”
Macro Headwinds Persist Despite Strong XRP ETF Demand
Broader market conditions have added to the pressure on digital assets. Rudolph noted that cryptocurrency markets have been weighed down by inflation concerns, elevated Treasury yields, uncertainty surrounding the path of U.S. interest rates and geopolitical tensions involving the United States and Iran.
Higher oil prices and concerns about global growth have also reduced risk appetite across the broader crypto sector.
Despite those headwinds, institutional demand for XRP remained a notable bright spot. The IG analysis detailed that U.S.-listed spot XRP ETFs attracted about $118 million in net inflows during May, lifting cumulative inflows since launch to roughly $1.4 billion. Seven spot XRP ETFs now manage about $1.2 billion in assets, while XRP-focused funds drew approximately $35 million between May 20 and May 29 even as bitcoin and ether ETFs experienced combined outflows of around $2 billion.
Technical indicators remain bearish. On the 4-hour chart, the Relative Strength Index ( RSI) is at 24.51, signaling deeply oversold conditions, while the Moving Average Convergence Divergence ( MACD) remains negative, with the MACD line at -0.04153, the signal line at -0.03683 and the histogram at -0.00470, indicating downside momentum remains dominant.
The 14- and 21-period simple moving average readings are 1.17174 and 1.19137, respectively, both above the current XRP price and reinforcing the prevailing downtrend. Bollinger Bands show a lower band at 1.10638, a middle band at 1.18762 and an upper band at 1.26886, with XRP trading near the lower band, suggesting sellers remain in control despite the potential for a short-term bounce.
For XRP to improve its near-term posture, it would need to hold above the $1.09 area and recover toward $1.17 to $1.19. Failure to stabilize above recent lows would keep downside pressure in focus.


