1. Understanding the High Risks of Memecoins
Memecoins are infamous for their extreme price volatility, which can yield exponential gains or catastrophic losses. Here’s what you need to consider:
- Volatility: Prices can surge dramatically or drop 80–90% within a single day.
- Risk Management: Allocate capital wisely and avoid overleveraging.
- Research First: Always conduct your own research (DYOR) before entering the market.
Key Takeaway: Only invest what you’re willing to lose, and prepare for rapid market movements.
2. Using Momentum Indicators to Identify Trends
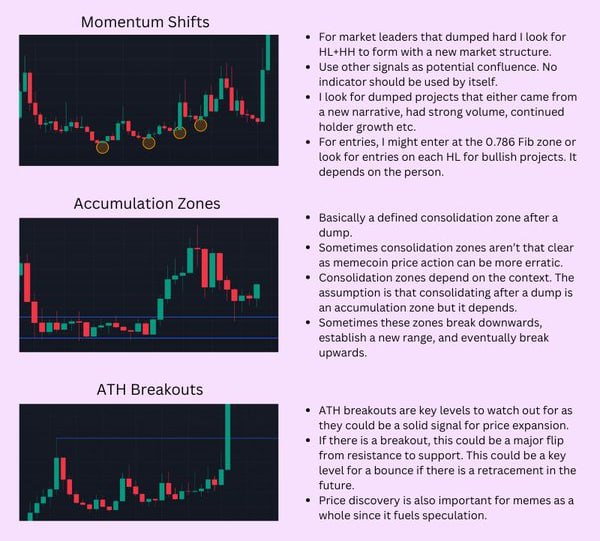
Momentum indicators help confirm whether a memecoin is gaining strength after a correction. Here are some techniques:
- Higher Highs (HH) and Higher Lows (HL):
- These signals indicate the formation of a bullish market structure after significant declines.
- Look for consistent HH and HL patterns to confirm an uptrend.
- Fibonacci Retracement:
- Focus on retracement levels like 0.786 for potential entry points.
- Identify higher lows (HL) that align with Fibonacci levels for increased accuracy.
- Additional Signals:
- Check for strong community engagement and a surge in trading volume.
- Projects with active social media and growing followers often attract speculative interest.
Pro Tip: Combine technical signals with fundamental factors to enhance decision-making.
3. Watching Accumulation Zones
Accumulation zones are periods of low volatility after steep price declines, often signaling potential opportunities.
- What to Look For:
- Sideways price movement at stable levels.
- Consolidation zones with rising trading volume.
- Why It Matters:
- Accumulation zones can precede either breakout rallies or further declines to establish new levels.
Key Tip: Monitor these zones for increased activity and breakout signals before taking positions.
4. Breaking All-Time Highs (ATH)
A price exceeding its previous ATH often signals strong bullish momentum. Here’s how to approach it:
- Confirm the Breakout:
- Price surpassing ATH indicates a likelihood of further upward price expansion.
- Support-Resistance Flip:
- If the ATH level turns from resistance to support, it may serve as a springboard for future gains.
Key Takeaway: ATH breakouts with sustained volume can offer prime entry points.
5. Leveraging Fibonacci Levels and Support/Resistance Zones
Fibonacci retracement and support/resistance levels are essential tools for identifying strategic entry points during corrections.
- Fibonacci Retracement:
- Key levels like 0.618 and 0.786 are ideal for entries during strong pullbacks.
- Support and Resistance:
- Observe for:
- Support zones holding firm.
- Resistance zones breaking.
- Double bottoms or historical price levels that often act as strong pivots.
- Observe for:
Key Tip: Use these levels to set clear stop-loss and take-profit points, reducing emotional trading.
Practical Example: Applying TA to Memecoins
Let’s take a hypothetical memecoin trading scenario:
- Initial Observation:
- The price of “MemeToken” has dropped 70% from its ATH and is consolidating.
- Trading volume starts increasing in the accumulation zone.
- Momentum Analysis:
- Identify higher lows (HL) forming alongside Fibonacci 0.786 retracement.
- Breakout Confirmation:
- Price breaks above the previous ATH with significant volume.
- Resistance flips into support, confirming bullish momentum.
- Entry and Exit:
- Enter near the Fibonacci 0.618 or after confirming the ATH breakout.
- Set stop-loss below the recent higher low to manage risk.
Outcome: Combining TA signals and risk management maximizes profit potential while minimizing losses.
Final Thoughts
Memecoins can deliver extraordinary returns but come with equally high risks. Using technical analysis tools like Fibonacci retracements, momentum indicators, and support/resistance zones can improve your chances of entering and exiting trades effectively. Always manage your risk and avoid emotional decisions to thrive in this volatile market.
Disclaimer: This content is for informational purposes only and should not be considered financial advice. Always conduct your own research before making investment decisions.


