Since 2011, Bitcoin has delivered the highest raw returns of any major asset class by an enormous margin. It has also handed investors losses exceeding 80% on two separate occasions, and in 2026 it has trailed gold by a wide margin as geopolitical tensions sent investors toward traditional safe havens. Both things are true, and understanding the full picture is the point of this article.
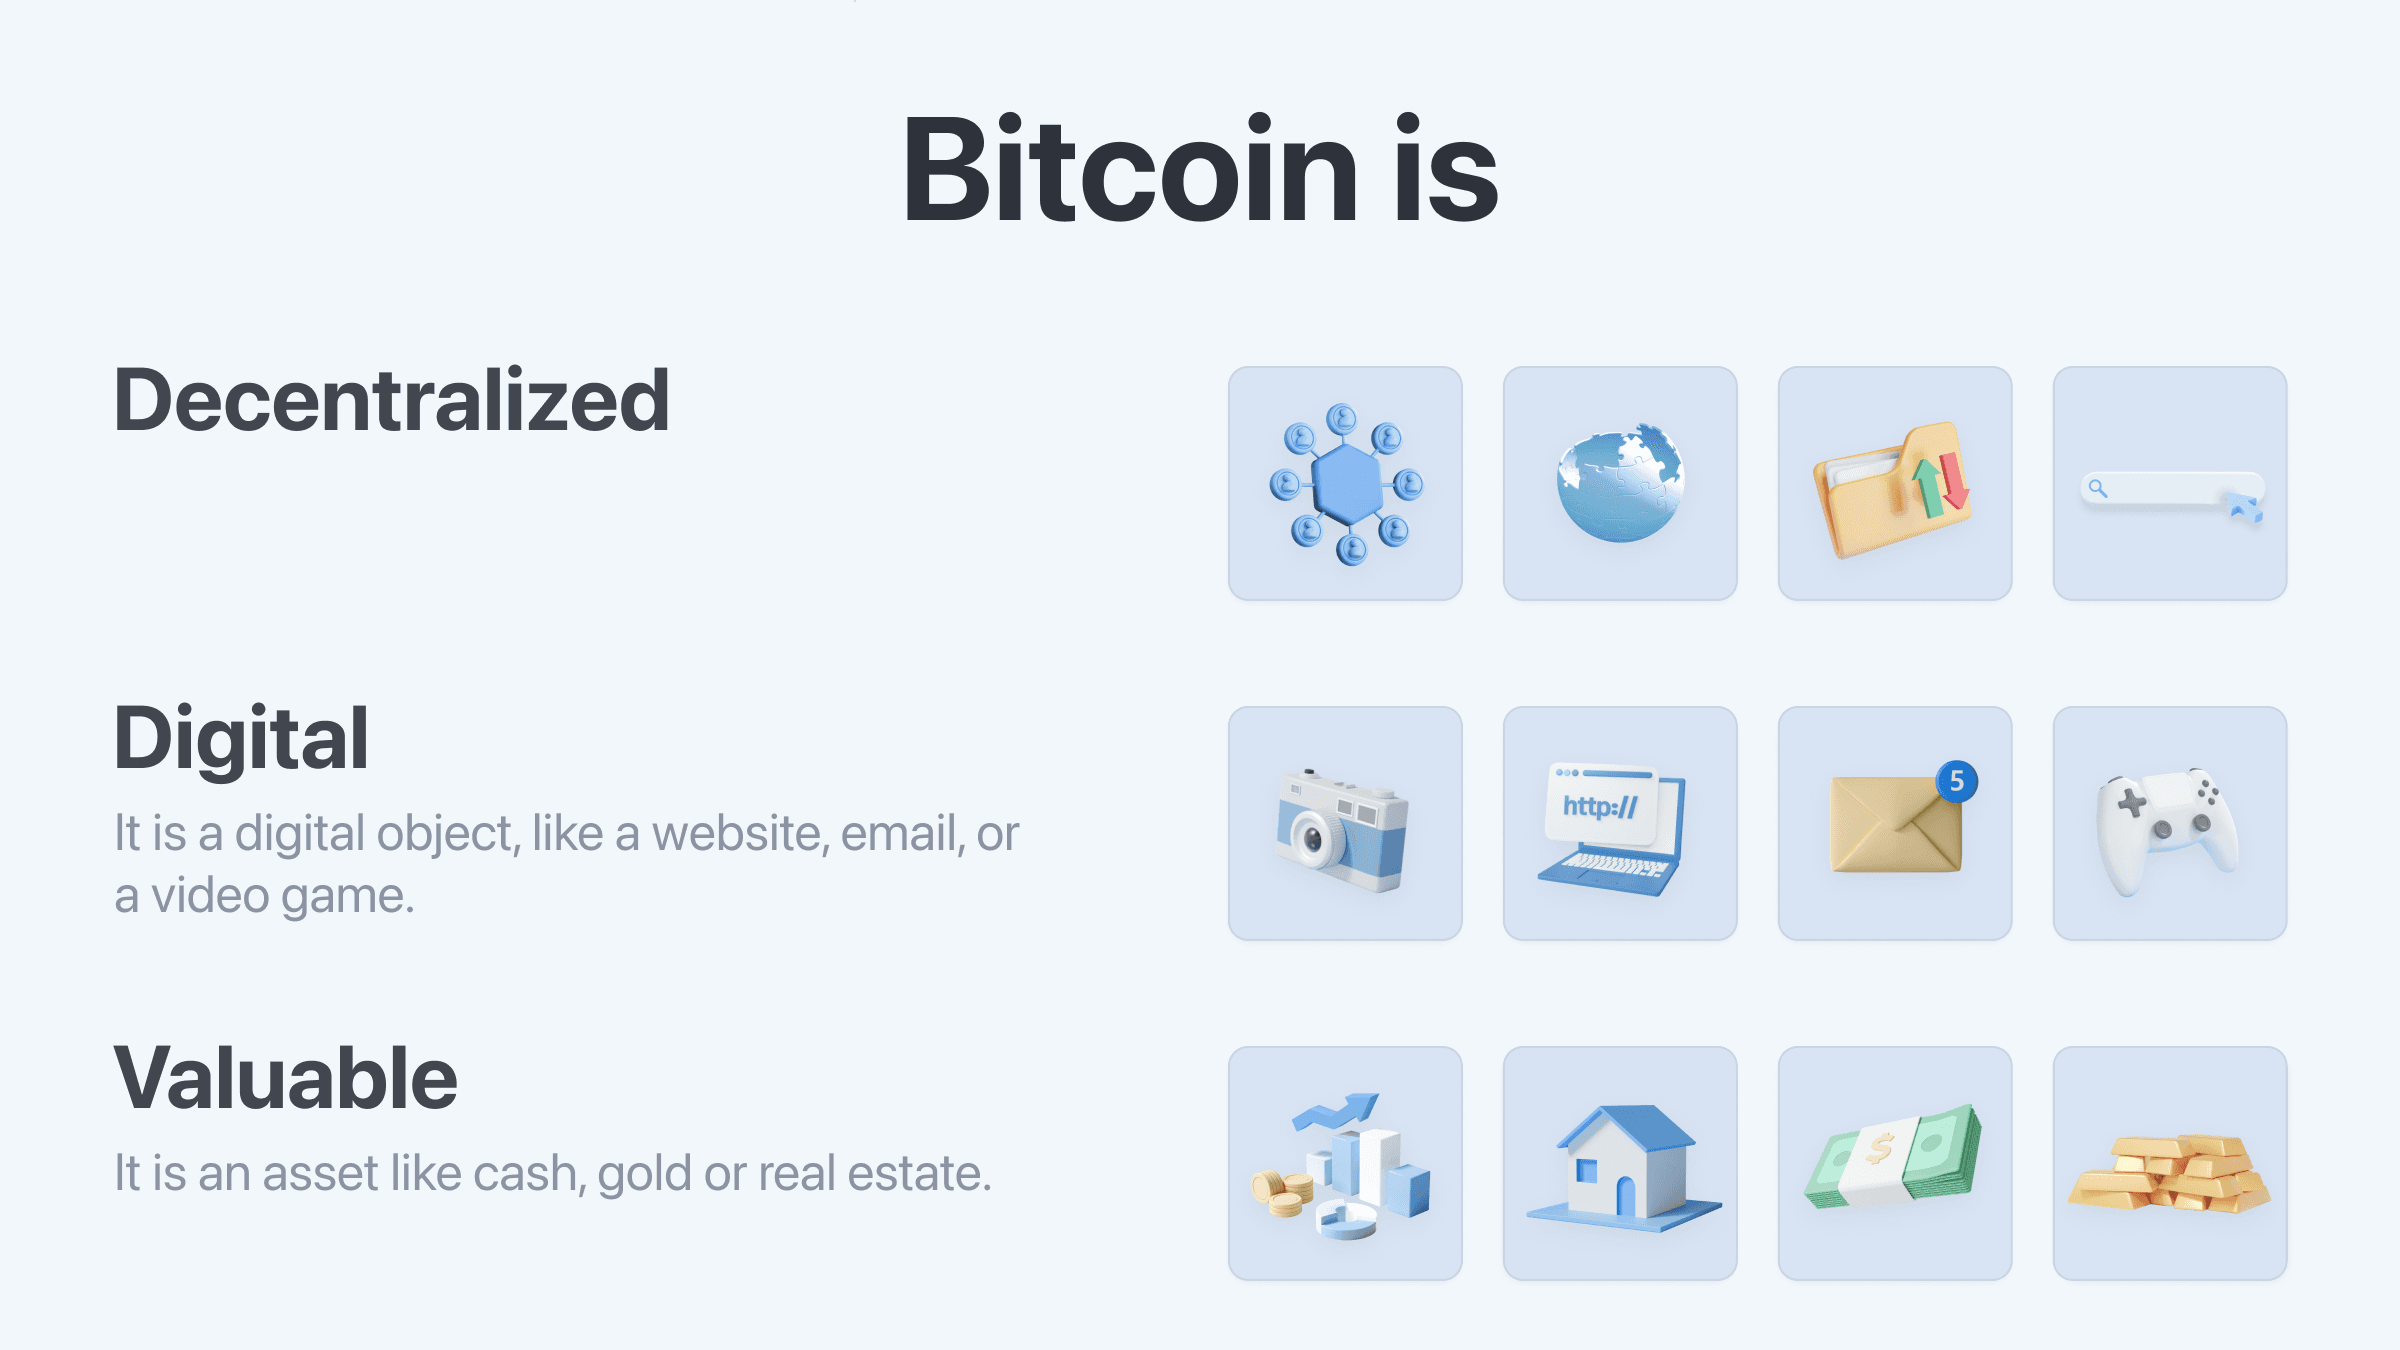
Bitcoin is a decentralized digital currency with a fixed maximum supply of 21 million coins. As an investment, it does not fit neatly into any existing category. It carries the volatility of a speculative growth asset, the supply-scarcity story of a commodity, and properties that some compare to gold. Whether you already hold some or are still deciding if it belongs in your portfolio, knowing how it stacks up against stocks, gold, silver, bonds, real estate, and commodities is worth understanding properly.
This guide covers Bitcoin’s long-term return history versus major asset classes, how its risk and volatility profile has evolved, what the correlation data actually shows in 2025-2026, and what the honest trade-offs look like.
Use the multichain Bitcoin.com Wallet app, trusted by millions to safely and easily buy, sell, trade, and manage Bitcoin and the most popular cryptocurrencies.
Key Takeaways
- Over the past decade, Bitcoin has delivered the highest raw returns of any major asset class by a substantial margin
- That outperformance comes with significantly higher volatility. Bitcoin’s annual price swings have historically been three to five times larger than those of equity indices
- Bitcoin’s correlation with the S&P 500 has risen substantially since 2020, meaning its portfolio diversification benefit is more limited than it was in its earlier years
- In 2026, Bitcoin has underperformed gold, which surged on geopolitical tensions. This highlights that Bitcoin does not yet behave as a reliable safe haven in every market environment
- Risk-adjusted metrics tell a more nuanced story. Bitcoin’s 2025 Sharpe ratio reached 2.42, placing it among the top 100 global assets on an efficiency basis, though that same ratio turned negative in early 2026 during a prolonged price decline
- Silver outperformed Bitcoin significantly in 2025, surging roughly 120% to break above $100/oz for the first time. Its dual role as both an industrial metal and a monetary asset gives it a different return profile from Bitcoin or gold
- Most institutional portfolio strategists now suggest a small allocation of 1-5% rather than using Bitcoin as a primary holding, often combining it with gold in what is increasingly called a “barbell” approach
What Is an Asset Class?
An asset class is a group of investments that share similar characteristics, behave similarly in markets, and are subject to the same regulatory framework. The traditional categories are equities (stocks), fixed income (bonds), real estate, commodities such as gold, and cash equivalents.
Bitcoin belongs to a newer category: digital assets. Goldman Sachs formally recognized Bitcoin as an investable asset class in 2022. The case rests on properties Bitcoin shares with other real assets, including scarcity, portability, and verifiability, while also having characteristics none of the traditional classes offer: open 24/7 trading, self-custody without intermediaries, and a supply schedule that is predetermined by software and cannot be altered without the consensus of the entire network.
Each asset class has conditions under which it tends to perform best. Equities generally outperform when the economy is growing and corporate earnings are strong. Gold tends to appreciate when inflation rises or geopolitical uncertainty spikes. Bonds provide steady income but are sensitive to interest rate changes. Real estate compounds steadily over time and generates rental income. Bitcoin, as of 2026, has demonstrated properties of both a growth asset and a commodity, while its safe-haven credentials remain a work in progress.
Bitcoin vs Other Asset Classes: Long-Term Returns
The raw return comparison over the past decade is stark. According to data analyzed by financial strategist Charlie Bilello and reported by CoinDesk in August 2025, Bitcoin has delivered an average annual gain of 141.7% since 2011, compared to 18.6% for the Nasdaq 100, 13.8% for U.S. large caps, 5.7% for gold, and mid-single digits for real estate and bonds.
The CoinGecko 10-year comparison (published March 2026), supplemented with silver data from market sources, captures the picture across multiple timeframes:
Asset10-Year Total Return1-Year Return (2024)1-Year Return (2025)Bitcoin26,931%129%~6% (decline from Oct peak)Silver~200%*~21%~120%S&P 500 (U.S. large caps)~193%23.7%~9.4%Gold~126%32.2%~65%U.S. 10-Year Treasuries~87%-2.6%Negative (real terms)U.S. Real Estate (REITs)~100%-0.93%Negative (rate pressure)AssetBitcoin10-Year Total Return26,931%1-Year Return (2024)129%1-Year Return (2025)~6% (decline from Oct peak)AssetSilver10-Year Total Return~200%*1-Year Return (2024)~21%1-Year Return (2025)~120%AssetS&P 500 (U.S. large caps)10-Year Total Return~193%1-Year Return (2024)23.7%1-Year Return (2025)~9.4%AssetGold10-Year Total Return~126%1-Year Return (2024)32.2%1-Year Return (2025)~65%AssetU.S. 10-Year Treasuries10-Year Total Return~87%1-Year Return (2024)-2.6%1-Year Return (2025)Negative (real terms)AssetU.S. Real Estate (REITs)10-Year Total Return~100%1-Year Return (2024)-0.93%1-Year Return (2025)Negative (rate pressure)
Returns based on ETF proxies and available index data. Past performance does not indicate future results.
A $100 investment in Bitcoin at the start of 2014 would have grown to more than $26,900 by early 2026. The same $100 in the S&P 500 would have grown to roughly $293. Gold to about $226.
That framing carries a hidden assumption: that the investor held through two separate drawdowns exceeding 75%. A drawdown measures peak-to-trough decline. Bitcoin fell from roughly $20,000 to $3,200 in 2018-2019, and collapsed from $69,000 to $16,000 in 2022. Investors who sold during either decline saw drastically different outcomes from those who held through to recovery.
Bitcoin vs Stocks: Risk, Return and Volatility
Stocks, and particularly the S&P 500, are the benchmark most investors default to when evaluating any new asset. The comparison between Bitcoin and stocks is instructive, and not straightforwardly in Bitcoin’s favor on every dimension.
In 2024, Bitcoin returned 121% versus the S&P 500’s 25%. In 2025, Bitcoin was up 25% year-to-date as of early August, trailing gold’s 29% but ahead of the Nasdaq 100 at 12.7% and U.S. large caps at 9.4%, according to Bilello’s data reported by CoinDesk. By 2026, the picture shifted as Bitcoin slid significantly from its October 2025 peak near $126,000.
Bitcoin volatility is where the comparison gets complicated. BlackRock’s research from mid-2025 put Bitcoin’s annualized volatility at approximately 54%, compared to gold at 15% and global equities at 10.5%. Bitcoin’s price swings have historically been roughly three to five times larger than broad equity indices.
A useful way to evaluate whether that extra volatility is justified by returns is the Sharpe ratio. The Sharpe ratio measures how much return an investment delivers for each unit of risk taken. A ratio above 1.0 is considered acceptable; above 2.0 is very good. The S&P 500’s long-term Sharpe ratio typically sits between 0.5 and 0.7. According to research published by ARK Invest in September 2025, Bitcoin’s Sharpe ratio has averaged higher than all four major asset classes, including U.S. equities, bonds, real estate, and gold, across various five-year periods. In 2025 specifically, Bitcoin’s 12-month Sharpe ratio reached 2.42, placing it among the top 100 global assets by risk-adjusted returns, according to XBTO research published in December 2025. That same ratio turned negative in March 2026 as Bitcoin’s prolonged price decline eroded its risk-adjusted performance, a pattern consistent with previous bear markets.
One detail worth noting from BlackRock’s mid-2025 research: Bitcoin was, at that point, less volatile than 33 individual S&P 500 constituents, including Netflix, which averaged 53% realized volatility on a 90-day basis over the same period. The volatility gap between Bitcoin and individual high-growth equities is narrowing, even if the gap with broad indices remains wide.
Bitcoin vs Gold: The Digital Gold Debate
Gold is the comparison most people reach for when describing Bitcoin, and there is genuine logic behind it. Both have a finite or near-finite supply. Neither generates cash flow or dividends. Both are used as a partial hedge against currency debasement, and both are held by investors who distrust centralized monetary systems.
The case for calling Bitcoin “digital gold” rests on its 21-million-coin supply cap, which is enforced algorithmically and cannot be changed without overwhelming network consensus. Gold’s supply grows by roughly 1.5-2% per year through mining. Bitcoin’s supply growth rate was cut in half by the April 2024 halving event, a built-in mechanism that reduces the rate at which new Bitcoin is created, and will continue halving approximately every four years.
The performance data since 2011 shows an enormous gap. According to CoinGecko data published in March 2026, Bitcoin’s 10-year return was 26,931% versus gold’s approximately 126%. On an annualized basis since 2011, Bitcoin has delivered 141.7% per year versus gold’s 5.7%, per Bilello’s figures.
Where they diverge most clearly is in crisis behavior. State Street Investment Management’s September 2025 analysis found that gold’s correlation with the S&P 500 has been approximately 0.01, essentially zero, while Bitcoin’s correlation with U.S. large caps runs between 0.22 and 0.35 under normal conditions and spikes higher during market stress. Gold tends to decouple from equities precisely when investors most need it to. Bitcoin does this less reliably.
The first half of 2026 has been an instructive real-world test. Gold surged as geopolitical tensions in the Middle East escalated, with crude oil hitting $119.48 intraday in late February 2026 following military action involving the U.S. and Israel, and safe-haven demand flowing heavily into gold. Bitcoin continued sliding from its late-2025 highs. CoinGecko’s March 2026 data showed crypto’s year-to-date correlation with gold had turned negative at -0.69, meaning the two assets were moving in opposite directions. A portfolio holding both would have benefited from that divergence, but it also confirms Bitcoin was not functioning as a safe haven during that stress period.
This does not invalidate Bitcoin’s long-term store-of-value thesis. It is, however, an honest data point for anyone considering Bitcoin as a direct gold substitute.
Bitcoin vs Bonds: Different Functions, Different Roles
Bonds are income-generating instruments. They pay regular interest and return principal at maturity. Their value moves inversely with interest rates, so when rates rise, existing bond prices fall.
The 2021-2023 rate-hiking cycle was painful for fixed income. The Bloomberg U.S. Aggregate Bond Index returned -13% in 2022, the worst year for bonds since the 1970s. As of early 2026, Fidelity Digital Assets‘ March 2026 report notes that bonds’ Sharpe and Sortino ratios have turned negative in recent years on a nominal basis, and that real returns after accounting for inflation have been negative for most of the post-2020 period.
Bitcoin and bonds do not compete for the same function in a portfolio. Bonds belong there for stability, predictable income, and low correlation with equities. Bitcoin offers none of those properties. Where the comparison becomes relevant is in the portfolio allocation context: for investors who have reduced bond exposure because bonds failed to diversify during the 2022 sell-off, Bitcoin has been discussed as a partial substitute for that diversification budget. That argument requires accepting substantially higher volatility in exchange, and the logic depends on Bitcoin maintaining some degree of independence from equity markets, which has become less reliable since 2020.
Bitcoin vs Real Estate: Liquidity, Leverage and Returns
U.S. real estate has historically delivered annualized returns of roughly 8-10% per year when combining price appreciation with rental income. With mortgage leverage, where a buyer puts 20% down and controls 100% of the property’s appreciation, the effective return on invested capital can be considerably higher.
Bitcoin’s raw 10-year compound annual growth rate of approximately 72%, far exceeds real estate’s. But two structural differences matter more than the headline number.
First, real estate is illiquid by design. Buying and selling property takes weeks or months and typically involves transaction costs of 5-10% on each side. Bitcoin trades 24 hours a day, 365 days a year, with transaction costs that are a fraction of a percent on most exchanges. For investors who may need to access capital quickly, that difference is significant.
Second, real estate generates income. Rental yields provide cash flow that compounds over time, and residential property has historically not experienced drawdowns anywhere close to the 77-84% declines Bitcoin investors have faced in past cycles. On a pure return basis, Bitcoin outperformed real estate in four of the last five years, according to data published by speed.app in March 2026. But real estate’s losses during Bitcoin’s worst years were far smaller. As Nexo’s April 2026 analysis summarized: Bitcoin has had higher peak returns over long holding periods; real estate has had more predictable, compounding returns with significantly less drawdown risk.
REITs (real estate investment trusts), the most liquid publicly traded proxy for real estate, had a difficult 2025 and early 2026 as elevated interest rates kept borrowing costs high. That reduced the performance gap with Bitcoin during that specific period, but the structural differences in liquidity, income generation, and volatility profile remain.
Bitcoin vs Silver and Commodities: The Other Hard Assets
Bitcoin is often compared only to gold, but 2025-2026 has made the broader commodities conversation impossible to ignore.
Silver finished 2025 up roughly 120%, briefly crossing $100 per ounce in January 2026 for the first time in history, according to market data reported by KuCoin and CCN in early 2026. That made it one of the strongest-performing major assets of the year, comfortably outpacing Bitcoin’s roughly 6% net change over the same period. Silver’s surge was driven by a combination of safe-haven buying alongside gold and structural industrial demand, particularly from the solar energy and electronics sectors, where silver is a critical input material. The Silver Institute flagged a persistent structural supply deficit heading into 2026, driven by those industrial pressures outpacing mine supply growth.
The comparison with Bitcoin reveals a meaningful difference in what each asset responds to. Bitcoin’s price is primarily driven by risk appetite, liquidity conditions, and crypto-native catalysts like the halving cycle. Silver moves on a combination of macro sentiment, currency dynamics, and physical industrial demand. When geopolitical stress sent investors toward tangible assets in early 2026, silver and gold both benefited. Bitcoin did not.
Oil tells a starker version of the same story. Crude oil spiked to $119.48 intraday in late February 2026 following escalating Middle East tensions, according to Investing.com data from April 2026. Energy commodities tend to rise during geopolitical crises because supply disruption risk is direct and physical. Bitcoin, despite its narrative as a censorship-resistant store of value, does not benefit from the same crisis mechanics.
The broader commodities point for portfolio construction is this: Bitcoin shares the “hard asset” label with gold, silver, and oil, but it behaves differently from all of them during macro stress events. It currently functions more like a high-beta risk asset than a commodity hedge, which matters when deciding what role it should play in a diversified portfolio.
Correlation, Bitcoin Portfolio Diversification, and the Portfolio Question
Correlation measures how much two assets move together. A correlation of 1.0 means they move in lockstep; 0.0 means they move independently; -1.0 means they move in exactly opposite directions. For portfolio construction, low or negative correlation is valuable because it reduces overall portfolio volatility without necessarily reducing returns.
Bitcoin’s correlation story has shifted substantially since 2020, and most educational content has not caught up.
In the 2018-2020 period, Bitcoin’s correlation with the S&P 500 ranged from 0.08 to 0.15, which is effectively uncorrelated. After the approval of spot Bitcoin ETFs in early 2024 and the resulting institutional adoption, correlations have structurally increased. Research published by Phemex in April 2026 reported Bitcoin-S&P 500 correlation at 0.74 during stress periods, close to the behavior of a leveraged equity position rather than an independent diversifier.
A February 2026 academic study using data from 2017 to 2025 found that dynamic conditional correlations between Bitcoin and the S&P 500 had risen from a pre-institutional baseline of 0.08-0.15 to a post-ETF structural level of 0.40-0.55, with crisis-period spikes exceeding 0.60. The study’s conclusion: Bitcoin’s diversification benefits are real but regime-dependent, and systematically unavailable during the stress periods when diversification is most needed.
This is not the same as saying Bitcoin has no diversification value. Bitcoin’s correlation with gold has remained substantially lower. That low correlation makes the combination of the two assets genuinely complementary, which is why a growing number of institutional strategists now advocate for what Mudrex described in April 2026 as a barbell approach: a gold allocation of 10-15% for crisis insurance and lower volatility, combined with a Bitcoin allocation of 5-10% for asymmetric upside in periods of liquidity expansion. A 2025 survey found 59% of institutional investors planned to increase their Bitcoin allocations, viewing it as a strategic diversifier amid rising inflation and geopolitical uncertainty.
This shift also has implications for the classic 60/40 portfolio, the traditional allocation of 60% equities and 40% bonds that has defined institutional investing for decades. Bonds struggled significantly in 2022 and have produced negative real returns for much of the post-2020 period, undermining the diversification role they are supposed to play. Some advisors now advocate reducing bond exposure and replacing part of that 40% with alternatives including gold, commodities, and a small Bitcoin allocation. The logic is that Bitcoin, even with its increased equity correlation, provides better long-run return potential than bonds, and its low correlation with gold provides a different kind of diversification within the alternatives sleeve.
Conclusion
Bitcoin has established itself as a legitimate asset class. Its long-term return record is unlike anything traditional finance has produced, and the infrastructure required to hold it, including regulated ETFs, institutional custody, and mature derivatives markets, now exists for both retail and institutional investors.
That does not make the comparison simple. Bitcoin behaves more like a high-growth risk asset than a safe haven. Its correlation with equities has risen as institutional adoption has deepened. Its volatility, while compressing from historic highs, remains far above stocks, gold, or bonds. And 2026 has demonstrated that when geopolitical stress spikes, gold tends to attract safe-haven flows while Bitcoin does not.
Anyone comparing Bitcoin against other asset classes needs the full picture: the return record alongside the drawdown history, the improving Sharpe ratio alongside the correlation shift, and the long-term thesis alongside the short-term reality. The data supports including Bitcoin in a diversified portfolio. It does not support treating it as a substitute for every asset class it is often compared to.